Sample Size and Normality: Can the Shapiro–Wilk Test Be Misleading?
Statistical Analysis in Scientific Research: The Same Distribution, Different Conclusions In medical statistics, it is often…
Read more >In medical statistics, it is often assumed that a normality test—most commonly the Shapiro–Wilk test—provides a clear-cut answer: the data either follow a normal distribution or they do not.
In practice, however, the assessment of normality should be more nuanced. The result of a normality test depends strongly on the sample size. Why does this happen? Let us examine a simple example.
Consider the following dataset:
7, 7, 1, 5, 9, 8, 7, 5, 8, 6
For this dataset, the Shapiro–Wilk test produces a p-value of 0.107. This means that there is insufficient evidence to reject the null hypothesis of normality.
In practical terms, the result may be interpreted as suggesting that the data do not differ significantly from a normal distribution. But does this automatically mean that a parametric test can be used?
Let us investigate further.
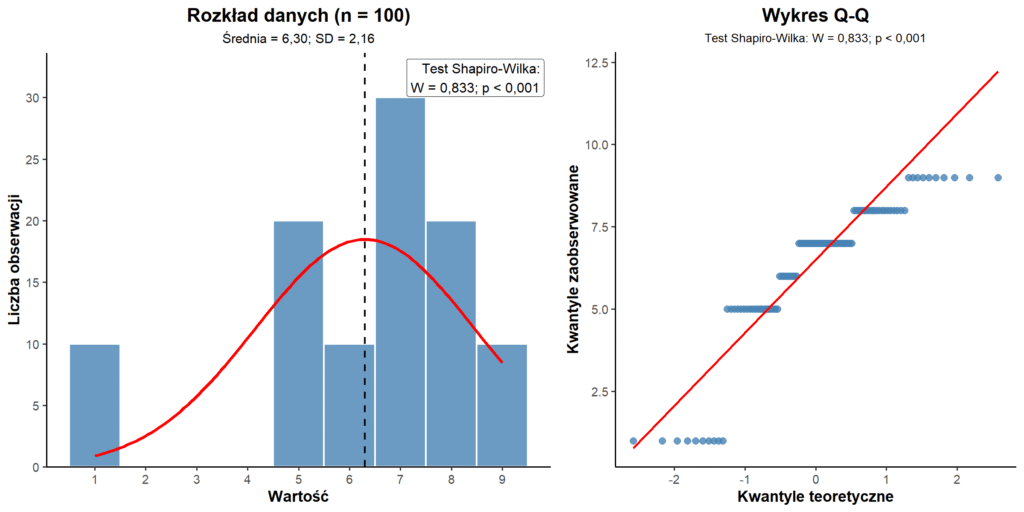
Now replicate exactly the same set of ten observations ten times. This produces a dataset with a sample size of n = 100. The shape and relative structure of the data remain unchanged; the only difference is the larger number of observations.
When the Shapiro–Wilk test is repeated using this larger dataset, it produces a p-value below 0.00000001.
Such a small p-value provides strong evidence against the assumption of an exactly normal distribution. Does this mean that a non-parametric test must now be used?
The underlying distribution has not changed. The same values occur in exactly the same proportions; there are simply ten times as many observations. Only the sample size has changed, yet the statistical conclusion is completely different.
Why does this happen?
The Shapiro–Wilk test does not answer the question:
Are the data sufficiently close to a normal distribution for the planned statistical analysis?
Instead, it tests whether the observed data are compatible with an exactly normal distribution.
This subtle distinction can have a major effect on the assessment of normality and the subsequent choice of statistical methods.
For n = 10, the Shapiro–Wilk test gives p = 0.107. If the decision were based solely on this p-value, the distribution might be treated as approximately normal.
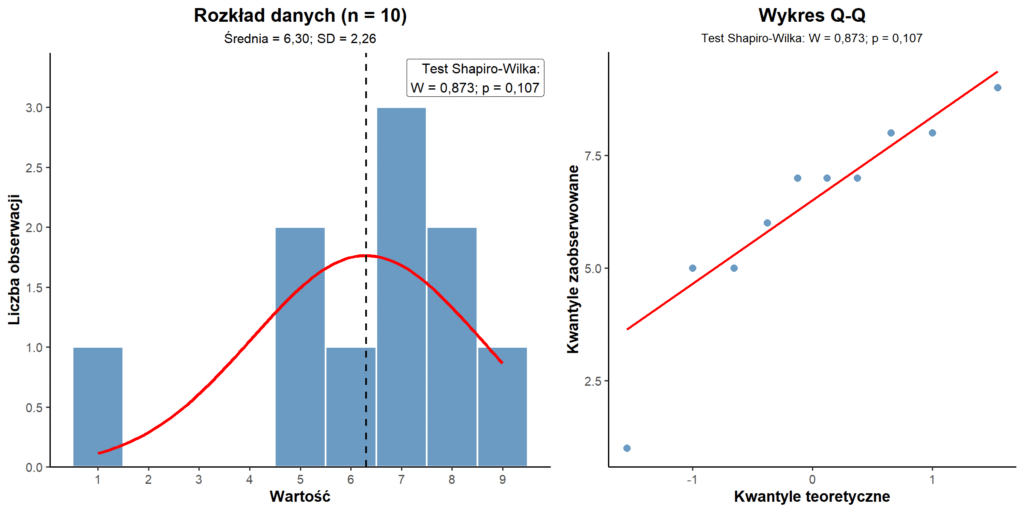
However, the histogram shows that the distribution is irregular. The Shapiro–Wilk test does not detect this departure because the sample is too small and the test has limited statistical power.
For n = 100, the Shapiro–Wilk test gives p < 0.001. If the decision were again based solely on the p-value, the distribution would be classified as non-normal.
However, the histogram has exactly the same shape as before, and the Q–Q plot shows the same underlying pattern. This time, the Shapiro–Wilk test detects the deviation because its statistical power is greater in the larger sample.
A commonly used approach in medical research is:
Shapiro–Wilk test p < 0.05 → non-normal data → use a non-parametric test.
The example above demonstrates why this rule may be misleading.
The same distribution may be classified as either “normal” or “non-normal” depending only on the number of observations. Consequently, the choice between a parametric and a non-parametric test may be inappropriate when it is based exclusively on the result of a normality test.
A statistically significant Shapiro–Wilk test does not necessarily mean that a parametric analysis is invalid. Similarly, a non-significant result does not prove that the data follow a normal distribution.
The practical importance of departures from normality depends on several factors, including the sample size, the presence of outliers, the degree of skewness, the statistical method being considered and the robustness of that method to violations of the normality assumption.
When conducting statistical analysis for scientific research, the result of a normality test should be considered alongside several other elements:
“Always look at your data” is one of the most useful principles in statistical analysis. It is simple, frequently neglected and extremely powerful.
A normality test should therefore be treated as one component of the assessment, not as the sole criterion determining which statistical test should be used.